Dev productivity, the elusive creature


In my experience working at Vercel and Sourcegraph as a Customer Success leader, dev productivity and DevEx were at the core of our work helping customers get the most value out of our dev tools and platforms; most of them were interested in measuring ROI and how their investment in a particular dev tool made their teams better overall.
However as I got closer and built stronger relationships with customer stakeholders, I quickly realized that they have very different views and opinions on how to measure dev productivity and DevEx. Most of it is rooted in the intrinsic differences of their core business objectives, but at the same time, a lot of discrepancy is based on a lack of standard frameworks or models to measure it. Sure, a few customers had some DevEx programs established and we were happy to couple into that to tie our own usage/adoption/consumption metrics to paint a value realization picture together. But most times, customers were looking up to us to help them define this. They had a vague idea of what good dev productivity looks like, but when it came down to measuring it to create improvement plans, most customers couldn't commit to a reliable methodology or process.
As I researched further, I found good resources out there that can help build a customizable toolkit to use with customer dev teams.
Dev Productivity and Developer Experience (DevEx)
According to Gartner, many organizations (around 78%) are adopting trends and findings from taking a more developer-centric approach to improving dev productivity known as DevEx. DevEx as a term started gaining traction in early 2018 when some papers like "What happens when software developers are (un)happy" and "DevOps metrics" were published. It describes how developers feel, think, and value their work in building software.
Some factors that improve or impact DevEx
Improve 📈
- Clear tasks
- Well-organized code
- Effective CI/CD and SDLC processes that lead to pain-free releases
- Job safety
Impact 📉
- Flow interruption
- Unrealistic or shifting deadlines
- Dev tools with poor UX
- Fragmented infrastructure
Previous work
Google, Microsoft (including GitHub), and the University of Victoria ran research and presented two frameworks that define metrics and dimensions that can be measured to get a sense of developer performance and productivity:
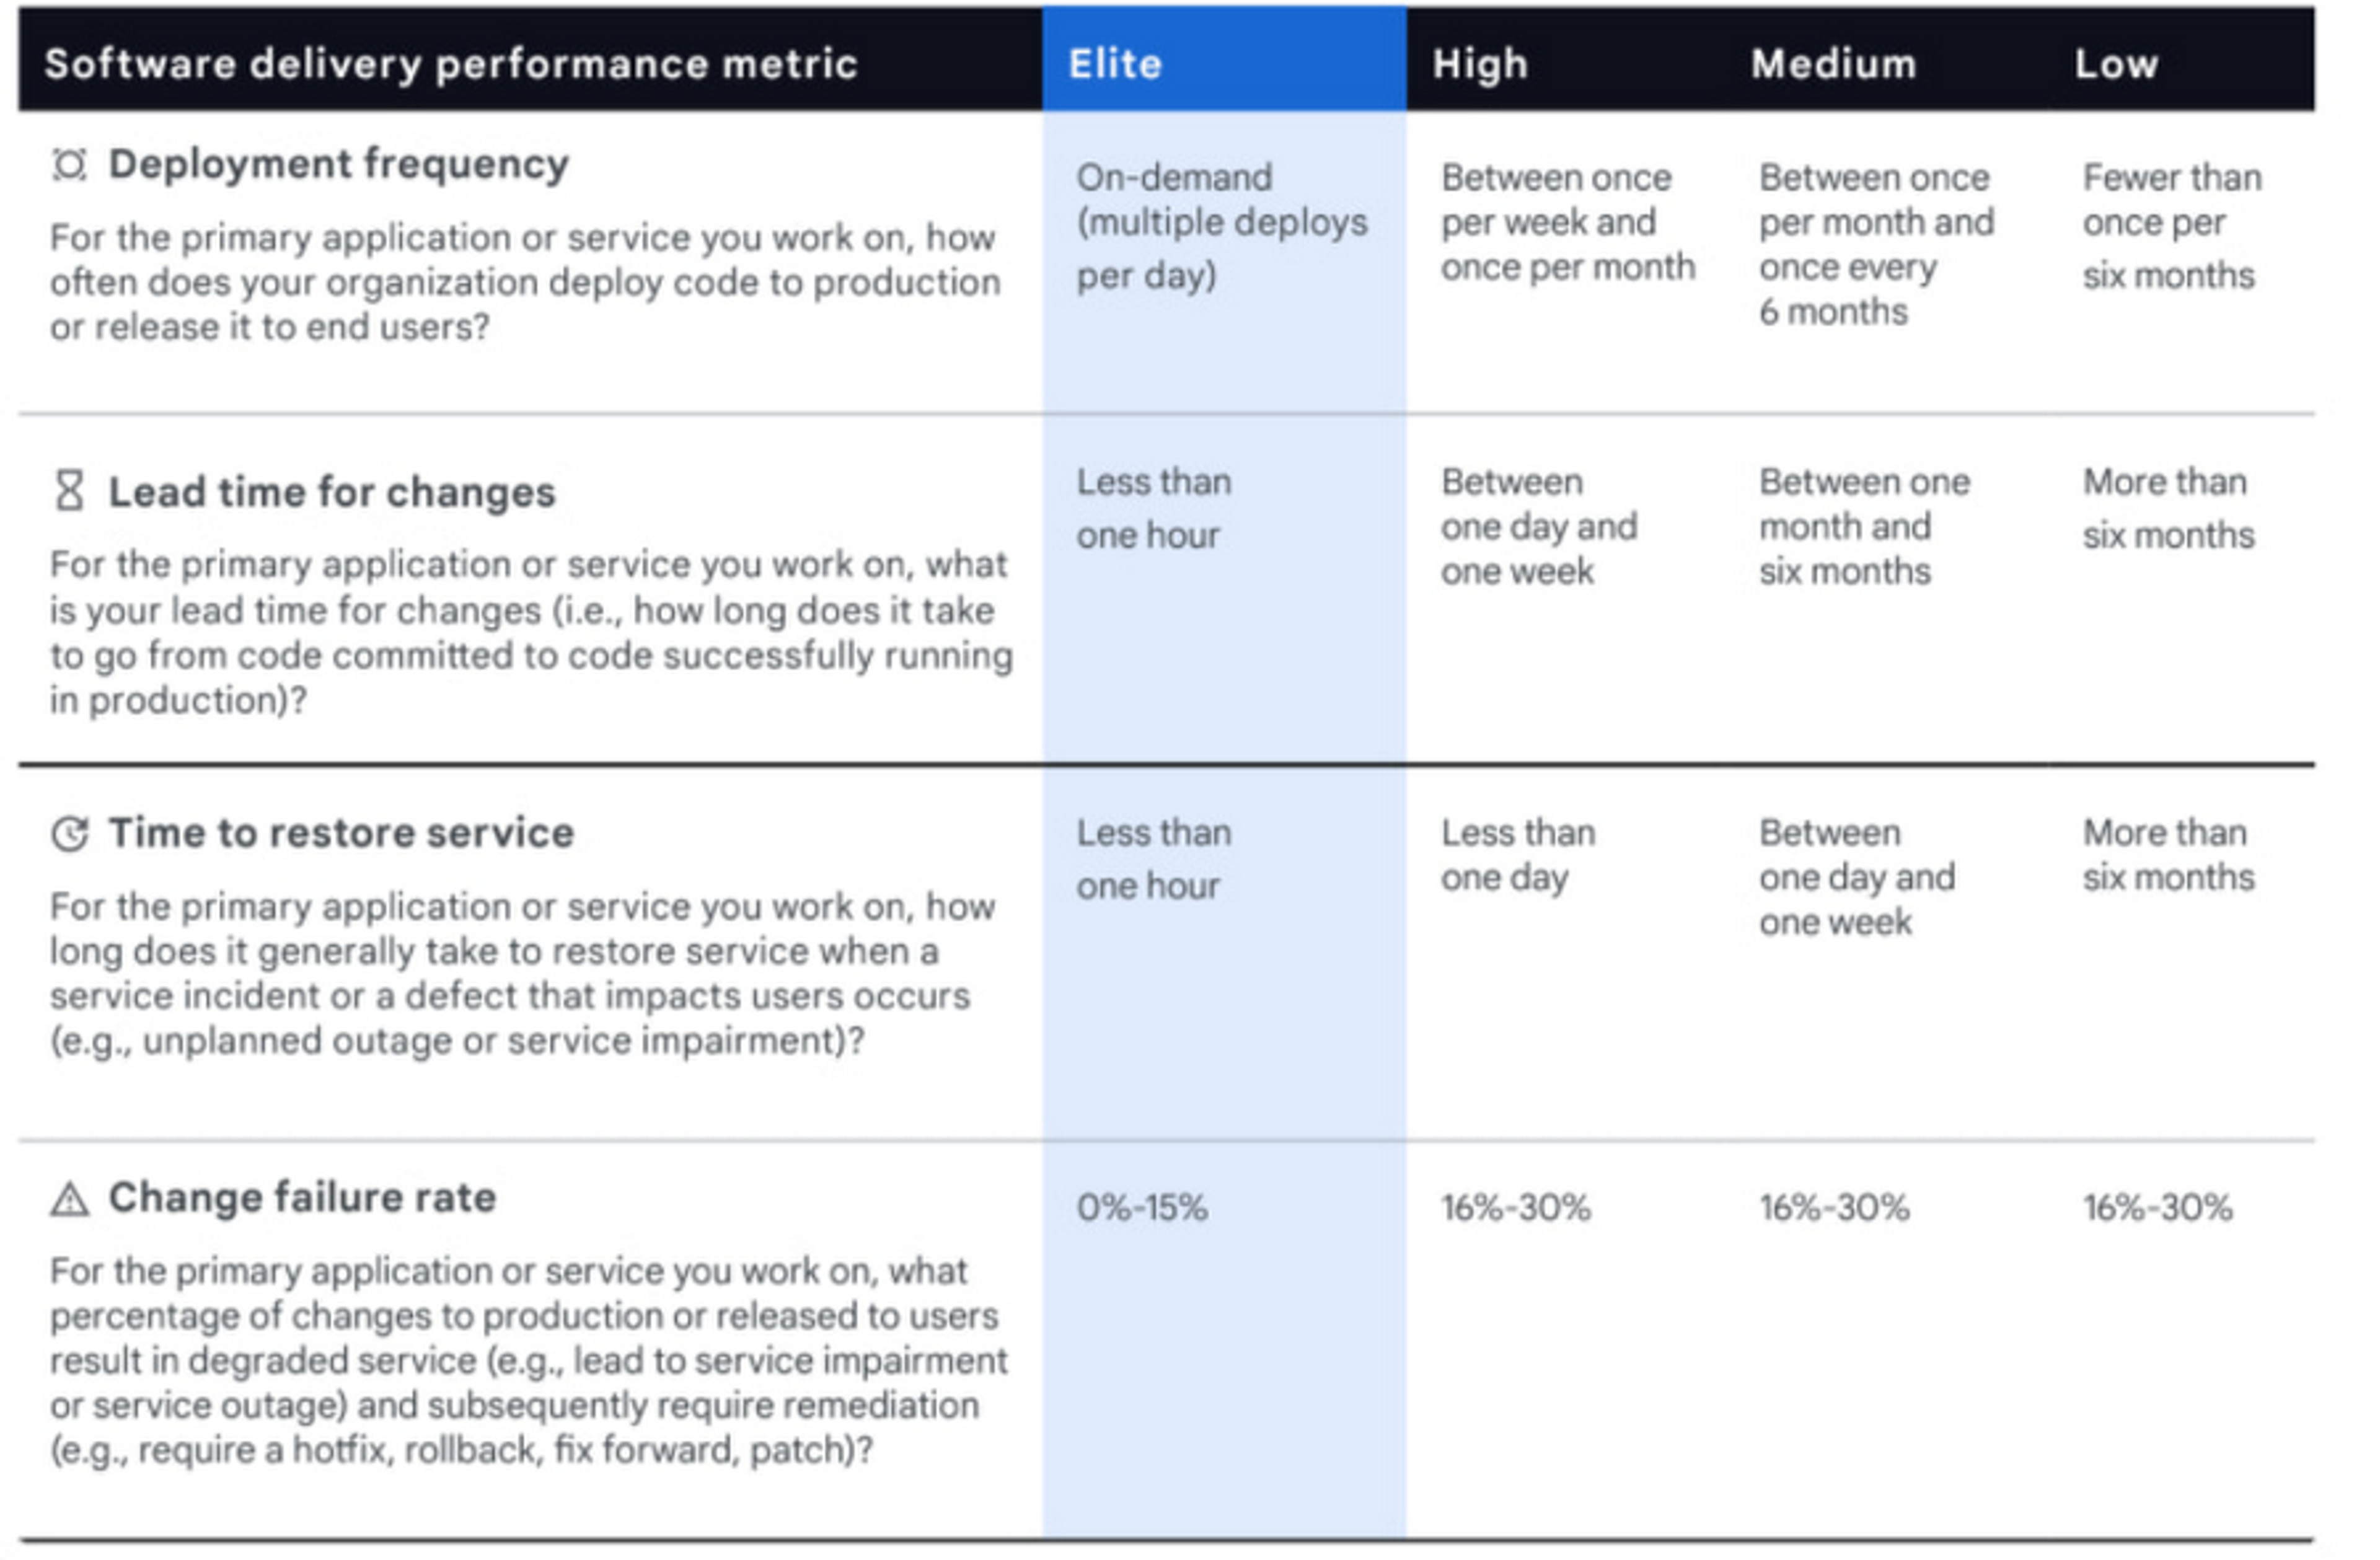
DORA
Google spearheaded the first widely adopted framework of 4 metrics back in 2020. Although a lot has changed since, just a year later Google revised it to add a fifth metric, keeping it relevant and still holding a lot of ground as a foundation.

- Deployment Frequency 🔄 — How often an organization successfully releases to production.
- Lead Time for Changes ⏳ — The time it takes a code commit to get into production.
- Change Failure Rate ⚠️ — The percentage of deployments causing a failure in production.
- Time to Restore Service ⏲️ — How long it takes an organization to recover from a failure in production.
- (🆕)Reliability 🤝 — The ability to meet or exceed reliability targets such as availability, latency, performance, and scalability.
DORA stands for Google Cloud's DevOps Research and Assessment.
SPACE
A year after Google's DORA framework, a team from GitHub, Microsoft, and the University of Victoria published a framework with 5 dimensions to measure developer productivity:
- Satisfaction and wellbeing 🧘 — How fulfilled developers feel with their work, team, tools, or culture; wellbeing is how healthy and happy they are, and how their work impacts it.
- Performance 🏃 — The outcome of a system or process.
- Activity 🔢 — A count of actions or outputs completed in the course of performing work.
- Communication and collaboration 🧑🤝🧑 — How people and teams communicate and work together.
- Efficiency and flow 🏄 — The ability to complete work or make progress on it with minimal interruptions or delays, whether individually or through a system.
New survey-based approaches
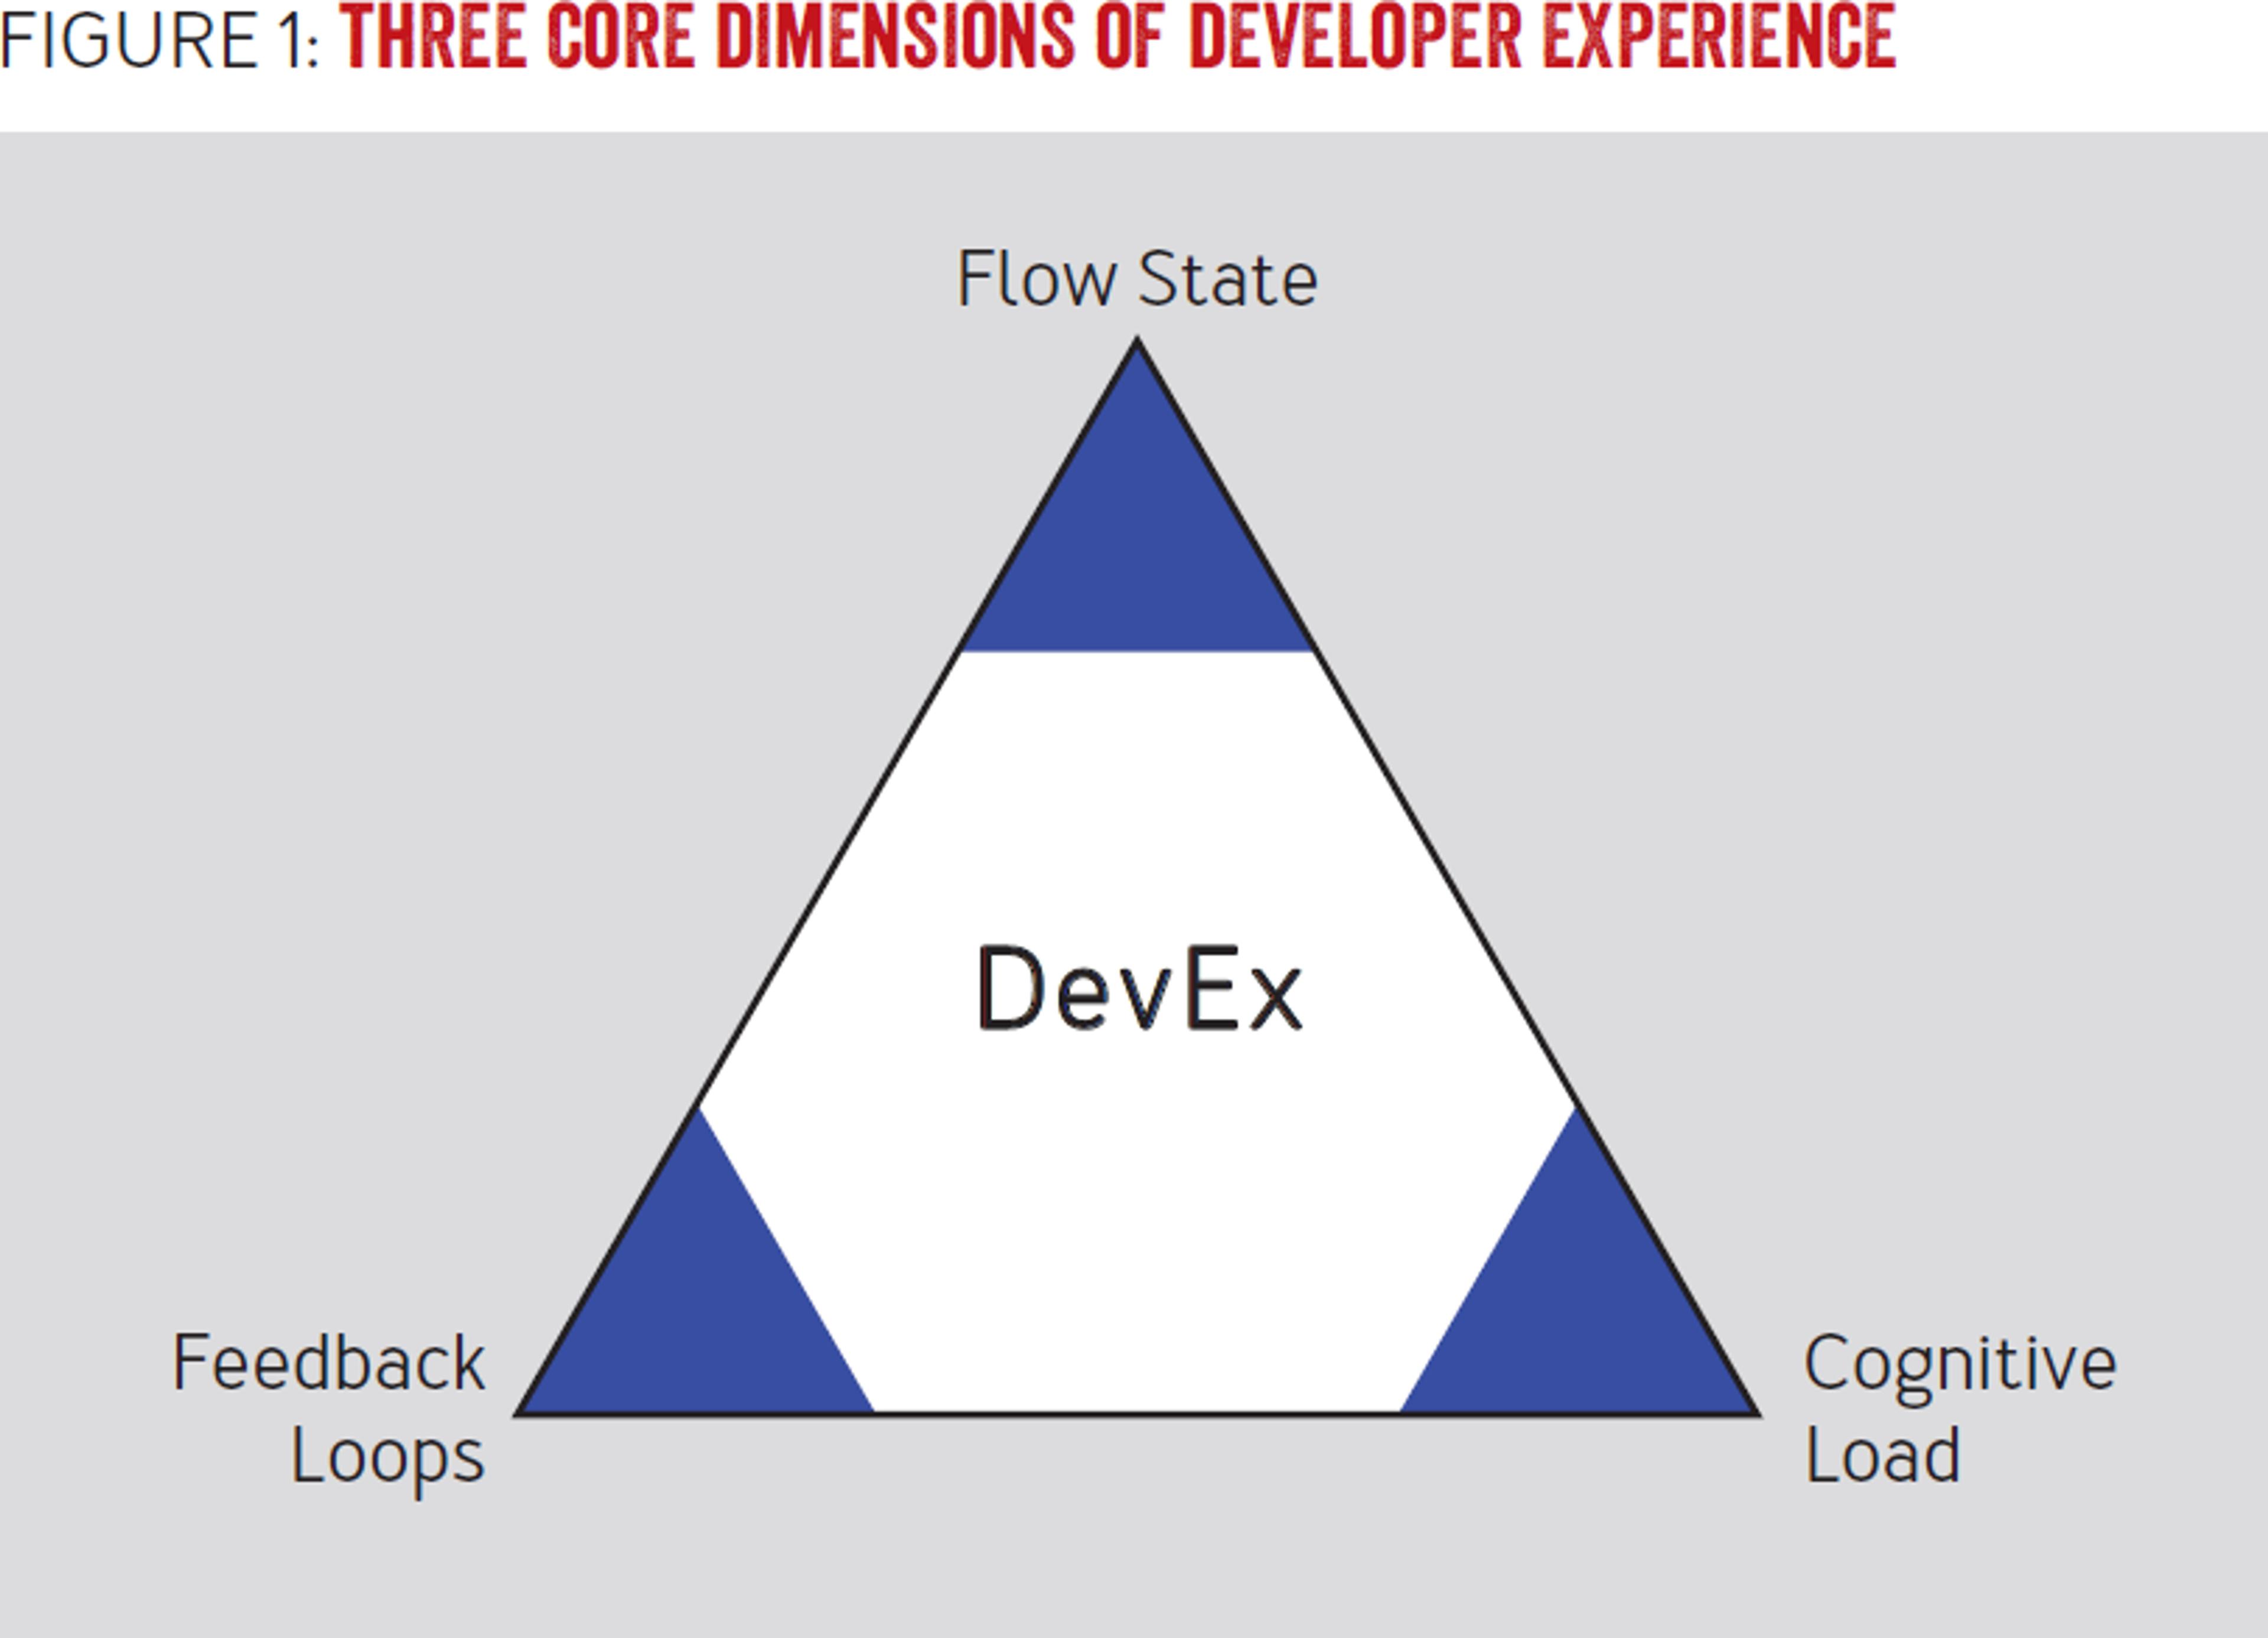
As reported by Gergely Orosz (The Pragmatic Engineer), Abi Noda (DX), Margaret-Anne Storey (University of Victoria), Nicole Forsgren, (Microsoft Research), and Michaela Greiler (DX) who took part in compiling DORA and SPACE wanted to take another crack at a framework that is based on surveys to have a better grasp of data from the field; the theory is that this approach is more likely to yield more trustworthy data about the success of the measurements. They published the paper called DevEx: What Actually Drives Productivity centered around three core dimensions:

These 3 dimensions encompass 25 sociotechnical factors that affect DevEx previously identified by this research team. This model greatly simplifies the complexities and nuances of the many factors that influence DevEx into 3 friction types that devs often encounter:
- Feedback Loops 🔁 — Reducing or eliminating delays in software delivery (shipping code fast and frequently). Studies show that companies that deploy code more frequently are twice as likely to exceed performance goals as their competitors because it allows for quicker feedback loops that empower course correction. Shortening feedback loops or the speed and quality of responses to actions performed is a key factor in improving DevEx.
- Flow State 🎧 — Possibly the most elusive concept 🦄 as it encompasses concepts like immersion, focus, feeling energized or inspired, enjoying the work, positive team culture, interruptions, delays, autonomy, clear goals, stimulation, and feeling challenged. DevEx will improve when companies work on creating the optimal conditions for flow state.
- Cognitive Load 🏋️ — The ever-growing number of tools and technologies in software development constantly makes the practice more complex and adds to the cognitive load that devs experience. The amount of mental processing to perform a task directly impacts the performance and experience of software development. Companies that aim to reduce cognitive load by simplifying tools, environments, docs, requirements, and processes will directly impact DevEx.
Measuring DevEx with surveys
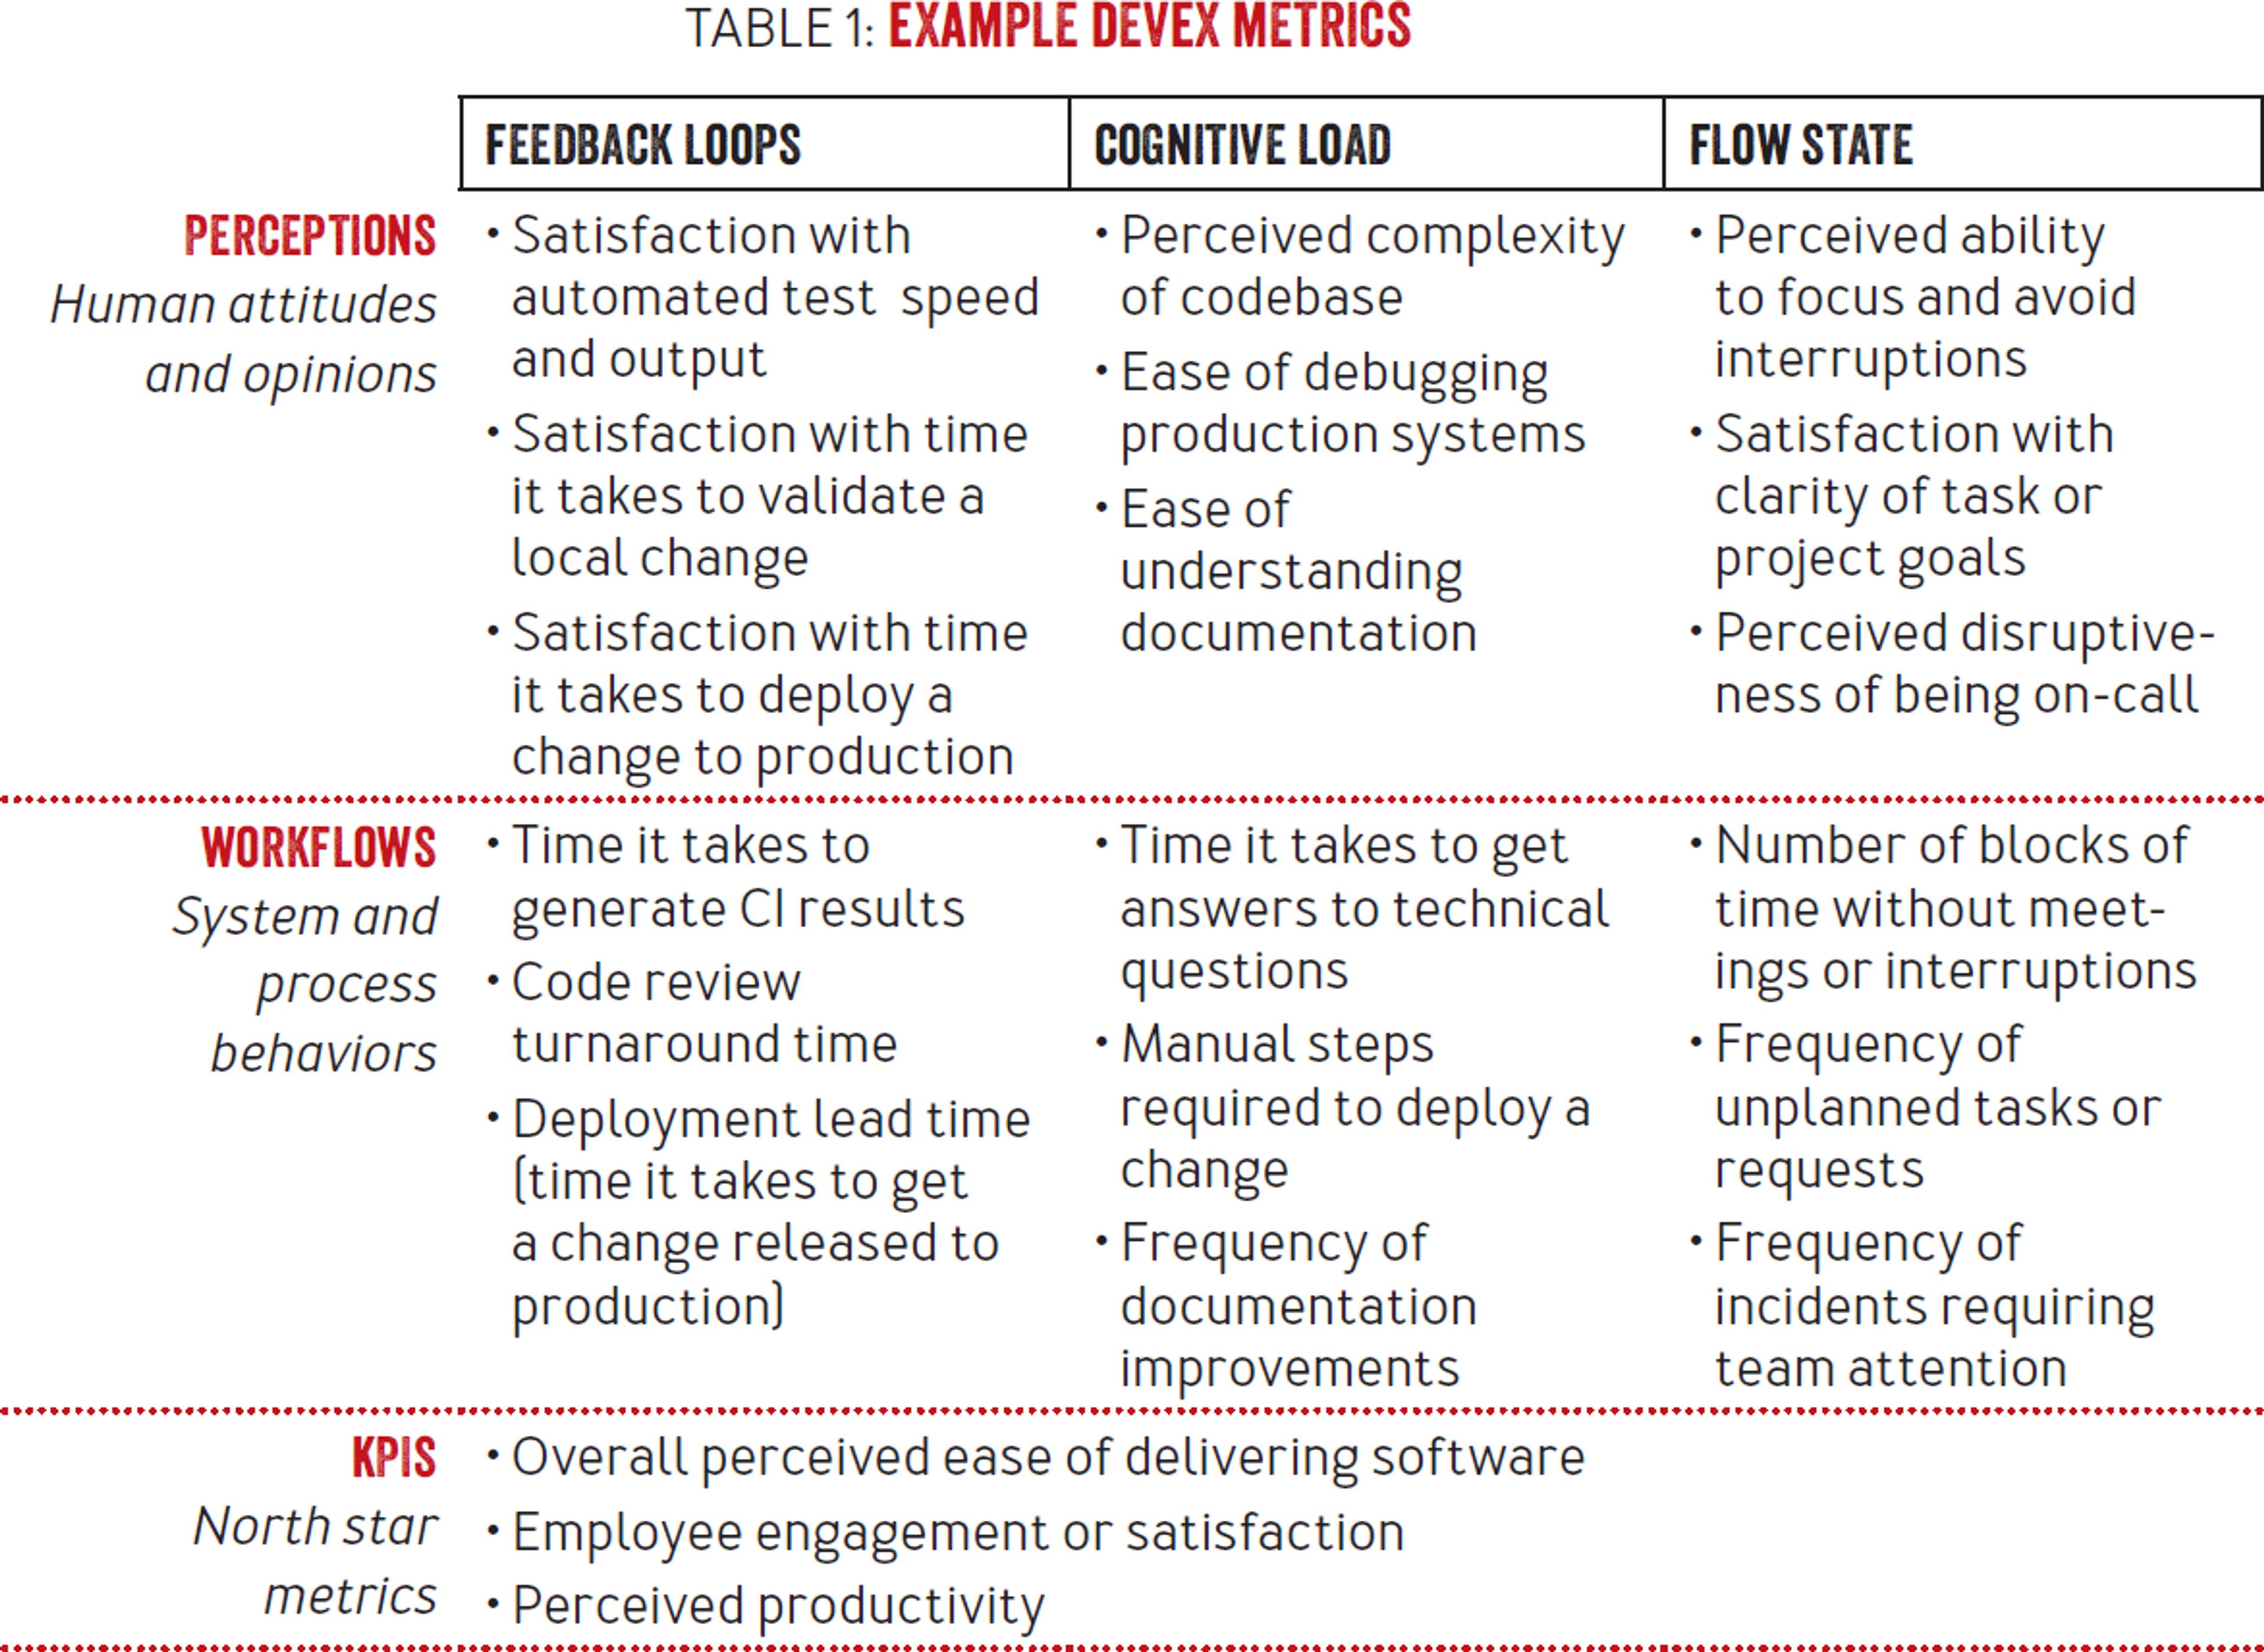
Most companies are already good at collecting development data from systems such as lines of code, number of Pull Requests (PRs), time spent in code review, bugs & defects in production, etc. Adding surveys as an additional data layer for feedback is very useful for uncovering friction points in software delivery. The research team proposes to measure the 3 pillars above against examples of perceptions (attitudes and opinions) and workflows (systems and processes):

They also share some recommendations about how to conduct these surveys:
- Define benchmarks before starting — Initial surveys will allow to record the initial state of all measures. Make sure these are shared widely across teams and orgs.
- Design surveys carefully — Avoid confusion by testing surveys with small groups before sending them more broadly. Consider hiring expert consultation.
- Break down results by team and dev persona — Consider using persona buckets such as role, tenure, and seniority to analyze results in addition to aggregate results to avoid diluting specific pain points experienced by smaller cohorts.
- Compare results against initial benchmarks — Perform comparative analysis to contextualize results not only within your team and org but against other companies in the same vertical/sector/business.
- Add milestone surveys — Send additional surveys (besides the regular schedule you have already defined) whenever there is a big milestone such as code migration, platform, pivot, etc to capture possible friction points and how they impact DevEx in particular.
- Avoid survey fatigue — Surveys with no action or follow-up break down trust in the practice and lead to fatigue. Keep a close eye on engagement and don't be afraid to play with cadence as long as it increases responses.
Mix-n-match to best suit your needs
Every customer engagement will be different but by compiling a toolkit of diverse ways to measure DevEx, any account manager can build a reliable and impactful methodology. DORA can give you hints about what data can be collected from SLDC or CI/CD systems to be analyzed with BI and create automated reporting, alerting, and monitoring. SPACE can give you foundations to build DevEx surveys that focus more on the dev perception of efficiency and satisfaction. The 3 pillars will allow you to articulate more concisely what factors are impacting DevEx positively or negatively that can lead to better value realization and ROI on dev tool spend.
In the end, it has become clear that a complimentary mix of data from systems and people (devs) centered around the user (the dev, again) is the approach that as of now has yielded the best results to measure DevEx with a high level of confidence.

